

Dal Sik Kim, M.D.
Department of Laboratory Medicine
Introduction
Blood viscosity represents the resistance to flow as blood circulates through the vasculature, serving as a key hemodynamic determinant that governs systemic circulatory homeostasis. Unlike simple homogenous fluids, blood is a complex non-Newtonian fluid composed of cellular elements—primarily erythrocytes, leukocytes, and platelets—suspended in plasma containing various proteins. Consequently, its viscosity varies depending on the velocity gradient (the shear rate), exhibiting a characteristic shear-thinning behavior where viscosity decreases as the shear rate increases.
Under normal physiological conditions, adequate tissue perfusion is maintained by a finely regulated balance among vessel diameter, blood flow velocity, erythrocyte deformability, erythrocyte aggregation, and plasma protein concentration. However, pathological elevations in blood viscosity augment flow resistance and markedly impair microcirculation. This not only induces localized tissue hypoxia but also serves as a critical driver of platelet activation and thrombus formation, mediated by elevated shear stress, abnormal wall shear stress, and endothelial mechanotransduction.
Conventional clinical practice heavily relies on
blood pressure measurements, blood glucose levels, lipid profiles, and imaging
studies to evaluate vascular diseases. However, these modalities inherently
provide static snapshots of vascular structure or metabolic status, failing to
directly reflect the dynamic physical and rheological state of circulating
blood. Accordingly, blood viscosity has gained traction as an integrative
biomarker that directly captures the dynamic state of blood flow and
microcirculatory function.
Historically, clinical blood viscosity testing was hindered by technical limitations; rotational viscometers and similar devices could only measure viscosity at a single, predefined shear rate at a time. This prevented a comprehensive assessment of hemodynamic behavior, limiting the test’s utility to patients with hyperviscosity syndrome secondary to specific hematologic malignancies or leukemias. Fortunately, the recent introduction of fully automated blood viscosity analyzers based on the scanning capillary method has enabled real-time, continuous measurement across a wide range of shear rates. This includes both high and low shear rates that closely approximate systolic and diastolic blood flow conditions, respectively, substantially expanding the clinical applicability of blood viscosity testing.
As measurement technology advances, modern medicine is increasingly embracing preventive, predictive, and personalized healthcare. Consequently, interest has grown in rheological indicators that can predict and assess vascular risk at an early stage, before the onset of overt clinical symptoms or structural tissue damage. Notably, a recent clinical study utilizing a fully automated scanning capillary tube viscometer (Yoon S, et al., 2025) successfully established reference intervals applicable to real-world clinical practice, further expanding the diagnostic utility of blood viscosity testing.
Hemodynamic Principles and the Scanning Capillary Method
To accurately characterize the shear-thinning behavior of blood in clinical settings, continuous measurement across both high-and low-shear rate ranges is essential. The scanning capillary method measures real-time changes in flow velocity under a continuously varying pressure gradient using a single blood sample. This approach maps viscosity changes across the entire systemic circulation—from large conductance arteries to microvessels—as an integrated, quantitative curve.
This method yields two key clinical parameters reflecting distinct hemodynamic properties:
1. High-Shear Viscosity (300 s⁻¹)
This parameter reflects rapid-flow conditions, such as those during cardiac systole or within large vessels like the aorta. Under high-shear conditions, erythrocyte deformability—whereby red blood cells elongate in the direction of blood flow under hydrodynamic forces—is the primary determinant of viscosity. Decreased erythrocyte membrane elasticity or increased intracellular viscosity causes a significant rise in high-shear viscosity, which impairs large-vessel flow and increases cardiac afterload.
2. Low-Shear Viscosity (1 s⁻¹)
This parameter reflects the microcirculatory and venous environments during cardiac diastole or under conditions of severely reduced flow velocity. In low-shear environments, erythrocyte aggregation—the reversible formation of "rouleaux" (cell stacks) mediated by large plasma proteins like fibrinogen—dominates as the key driver of viscosity. Consequently, alterations in plasma protein composition due to chronic inflammation or metabolic dysregulation markedly elevate low-shear viscosity, triggering microcirculatory stasis and microthrombus formation.
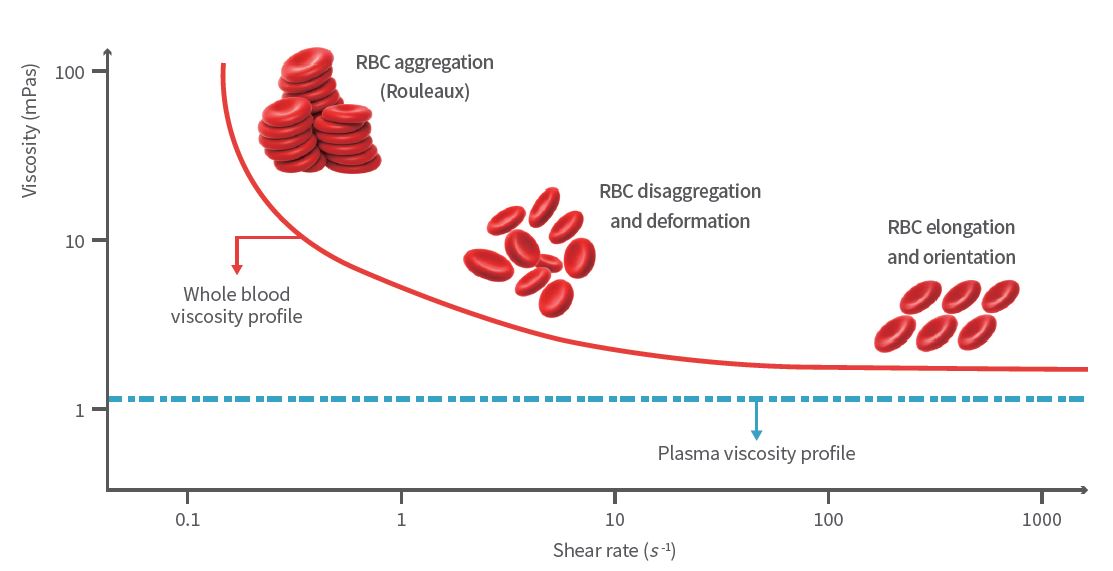
Ref) Am J Clin Pathol. 2006;125 Suppl:S78-86.
Fig. 1. Changes in whole blood and plasma viscosity according to shear rate
Principle of the Test
1. Conventional
Measurement Methods
Early blood viscosity measurements relied on the Ostwald capillary viscometer, which determined viscosity by measuring the time required for a fixed volume of fluid to flow through a capillary tube under the influence of gravity. While this gravity-driven approach laid the conceptual foundation for modern scanning capillary tube viscometers, its clinical utility was highly restricted.
Subsequently, rotational viscometers were developed to enable measurements at distinct shear rates by adjusting the rotational speed (RPM). Nevertheless, their clinical adoption remained limited. Because rotational viscometers require discrete, sequential measurements at each target shear rate, they cannot generate a continuous, real-time shear rate curve. Furthermore, the sustained mechanical shear stress inherent to rotational stimulation can artificially disrupt and alter the intrinsic aggregation state of erythrocytes. Beyond these rheological limitations, conventional systems require labor-intensive manual cleaning and highly skilled operators, rendering them unsuitable for the high-throughput processing of clinical specimens.
2. Scanning Capillary Method
The scanning capillary method continuously records the pressure gradient and flow velocity of blood passing through a capillary tube, determining blood viscosity across a spectrum of shear rates based on fluid dynamic principles. By simulating the native in vivo rheological environment, this method enables uninterrupted, continuous profiling from low to high shear rates within a single specimen. Crucially, because this approach minimizes the structural distortion of cellular elements caused by external rotational forces, erythrocyte aggregation in low-flow regions can be evaluated under near-physiological conditions, offering superior clinical relevance.
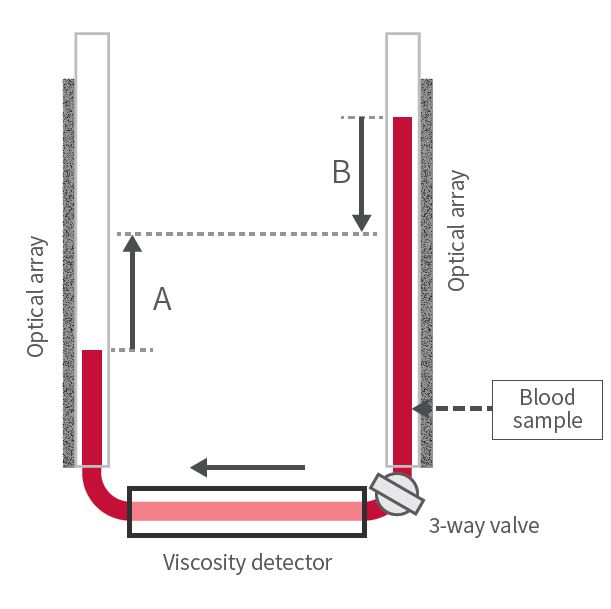
Ref) J Korean Med Sci. 2025;40(44):e287
Fig. 2. Schematic illustration of whole blood viscosity measurement at various shear rates using the scanning capillary method
Recently developed, fully automated blood viscosity analyzers utilizing the scanning capillary method have streamlined the entire analytical workflow. These systems automate barcode recognition, pre-analytical specimen mixing, sample aspiration, measurement, waste disposal, and reporting. This comprehensive automation has dramatically improved both reproducibility and operational efficiency. Leveraging these technological advancements, a recent study in South Korea (Yoon S, et al., 2025) successfully established clinical reference intervals for Korean adults using a fully automated blood viscosity analyzer (Table 1).
Table 1. Sex-specific reference intervals for whole blood viscosity measured using the RHEOVIS 200, a fully automated blood viscosity analyzer based on the scanning capillary method
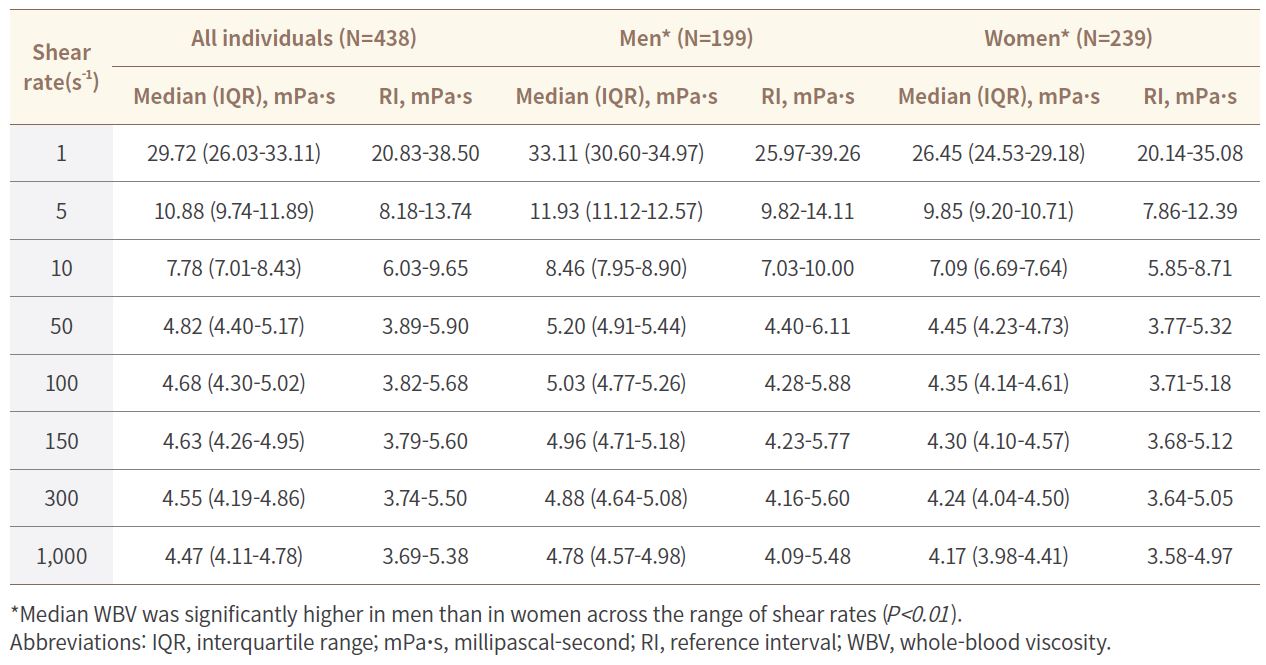
Ref) https://doi.org/10.3343/alm.2025.0495
Clinical Significance and Pathophysiological Implications of Increased Blood Viscosity
1. Cardiovascular,
Cerebrovascular, and Peripheral Vascular Diseases
In patients with hypertension, coronary artery disease, heart failure, and atrial fibrillation, elevated whole blood viscosity (WBV) is directly associated with altered local shear stress, which can precipitate atherosclerotic plaque rupture. Increased viscosity elevates vascular resistance, thereby augmenting cardiac afterload and exacerbating myocardial ischemia.
In the cerebrovascular system, hyperviscosity in patients with ischemic stroke, transient ischemic attack (TIA), and cerebral venous thrombosis reduces cerebral perfusion pressure and impairs collateral circulation, potentially expanding the infarcted area. Consequently, blood viscosity testing is highly valuable for the perioperative monitoring of hemodynamic profiles in these patient populations.
2. Metabolic and Endocrine Disorders
In patients with diabetes mellitus and metabolic syndrome, chronic hyperglycemia promotes the nonenzymatic glycation of erythrocyte membrane proteins. This reduces membrane flexibility and impairs erythrocyte deformability under high-shear conditions. Simultaneously, dyslipidemia and hormonal imbalances increase plasma lipid levels and acute-phase reactant proteins, significantly elevating low-shear viscosity. These rheological alterations serve as key mediators in the pathophysiological cascade underlying microvascular complications, such as diabetic retinopathy and diabetic nephropathy.
3. Renal and Urinary Tract Diseases
Patients with chronic kidney disease (CKD) and nephrotic syndrome are highly susceptible to disturbances in fluid homeostasis due to impaired glomerular filtration and proteinuria, which often lead to elevated plasma viscosity. Notably, erythropoietin-stimulating agent (ESA) therapy administered for renal anemia can—if dosed aggressively based solely on target hemoglobin levels—trigger a rapid increase in hematocrit, leading to a steep rise in WBV. This hyperviscous state may paradoxically exacerbate renal ischemia or cause thrombotic occlusion of arteriovenous fistulas (AVFs) in hemodialysis patients. Therefore, precise viscosity monitoring via the scanning capillary method serves as a critical safety indicator in these clinical scenarios.
4. Autoimmune, Hematologic, and Other Disease Groups
Autoimmune diseases, such as rheumatoid arthritis (RA) and systemic lupus erythematosus (SLE), drive marked elevations in fibrinogen synthesis as a consequence of chronic systemic inflammation, leading to a prior increase in low-shear WBV.
Hematologic malignancies, including polycythemia vera and multiple myeloma, also frequently present with classic hyperviscosity syndrome. In these conditions, the scanning capillary method serves not only as a diagnostic aid but also as an objective criterion for initiating therapeutic phlebotomy or plasmapheresis. Furthermore, this method is widely applied to monitor microvascular occlusive risks, such as central retinal vein occlusion (CRVO) and deep vein thrombosis (DVT) following major orthopedic surgeries.
5. Influence of Medications
Estrogen-containing oral contraceptives are known to increase plasma fibrinogen levels, elevate hematocrit, and subsequently raise blood viscosity—hemorheological alterations closely linked to an elevated risk of venous thromboembolism (VTE). Similarly, raloxifene—a selective estrogen receptor modulator (SERM) prescribed for osteoporosis—induces comparable hemorheological changes, increasing the risk of DVT and pulmonary embolism (PE). Accordingly, when prescribing these agents to patients with underlying thrombophilia or cardiovascular risk factors, clinical tracking of blood viscosity and hemorheological parameters should be carefully considered.
Conclusion and Future Perspectives
Blood viscosity testing via the scanning capillary method is a safe, minimally invasive, and clinically valuable biomarker that enables the continuous observation and quantification of microcirculatory rheological status from both macroscopic and microscopic perspectives. Supported by a growing body of clinical evidence—further catalyzed by its official designation as a New Health Technology by the Ministry of Health and Welfare (MOHW) of South Korea—the recently established reference intervals for healthy Korean adults provide a robust foundation for the standardized ordering and reliable interpretation of blood viscosity tests in real-world clinical practice.
Importantly, modern clinical paradigms increasingly recognize that patients sharing identical conventional risk profiles (e.g., blood pressure, blood glucose, and lipid levels) can exhibit different hemodynamic phenotypes and subsequent vascular risks depending on their individual blood viscosity. Recognizing these differences, active research is now focusing on the development of individualized blood viscosity profiles that integrate patient-specific hematocrit, fibrinogen levels, and intrinsic erythrocyte characteristics.
Looking forward, when organically integrated with diverse hemorheology-based therapeutic strategies—such as personalized fluid management, the optimization of microcirculation-enhancing agents, and the precise titration of antithrombotic therapies—blood viscosity testing is poised to play a pivotal role. It will serve as an indispensable rheological indicator, enabling the early identification of subclinical thrombotic risks and driving the transition toward truly patient-tailored precision medicine.
References
Test Information
GC Labs code | Test item | Specimen (mL) | Test schedule/ | Test method |
L526 | Whole blood viscosity test | EDTA WB 5.0 | Mon-Sat / 1 day | Scanning capillary method |
* The above information is as July 1, 2026, and may change later. Please visit our website for the latest updates